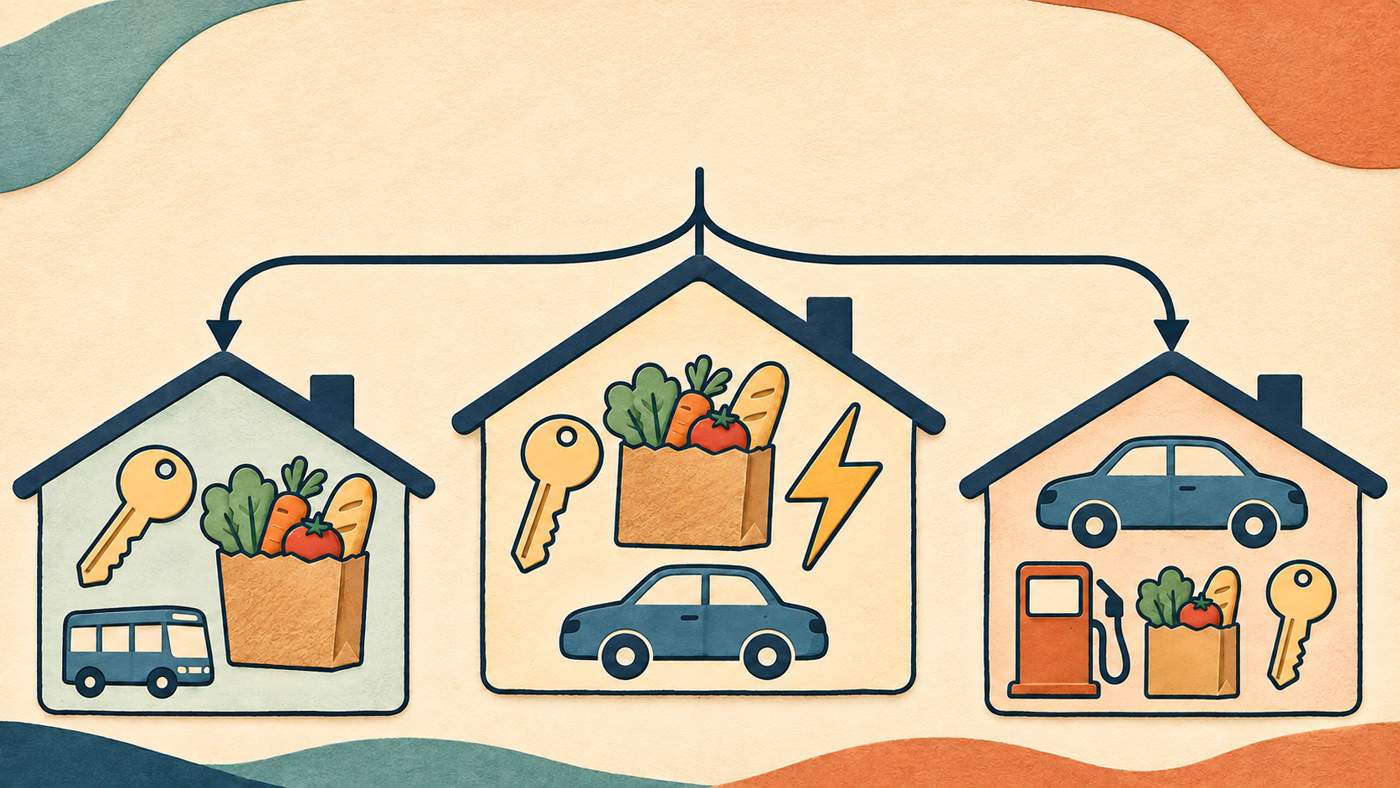
You hear that inflation is cooling, yet your grocery, rent and gas bills still feel heavy. Both things can be true. The headline figure is an average built from a typical household's spending, and no single household spends exactly that way.
What does an inflation rate actually measure?
The European Central Bank (ECB) describes inflation as a broad increase in the prices of goods and services, not a rise in individual items. The ECB's explainer is about the euro area, but the basic logic of a price index applies to any country that publishes one.
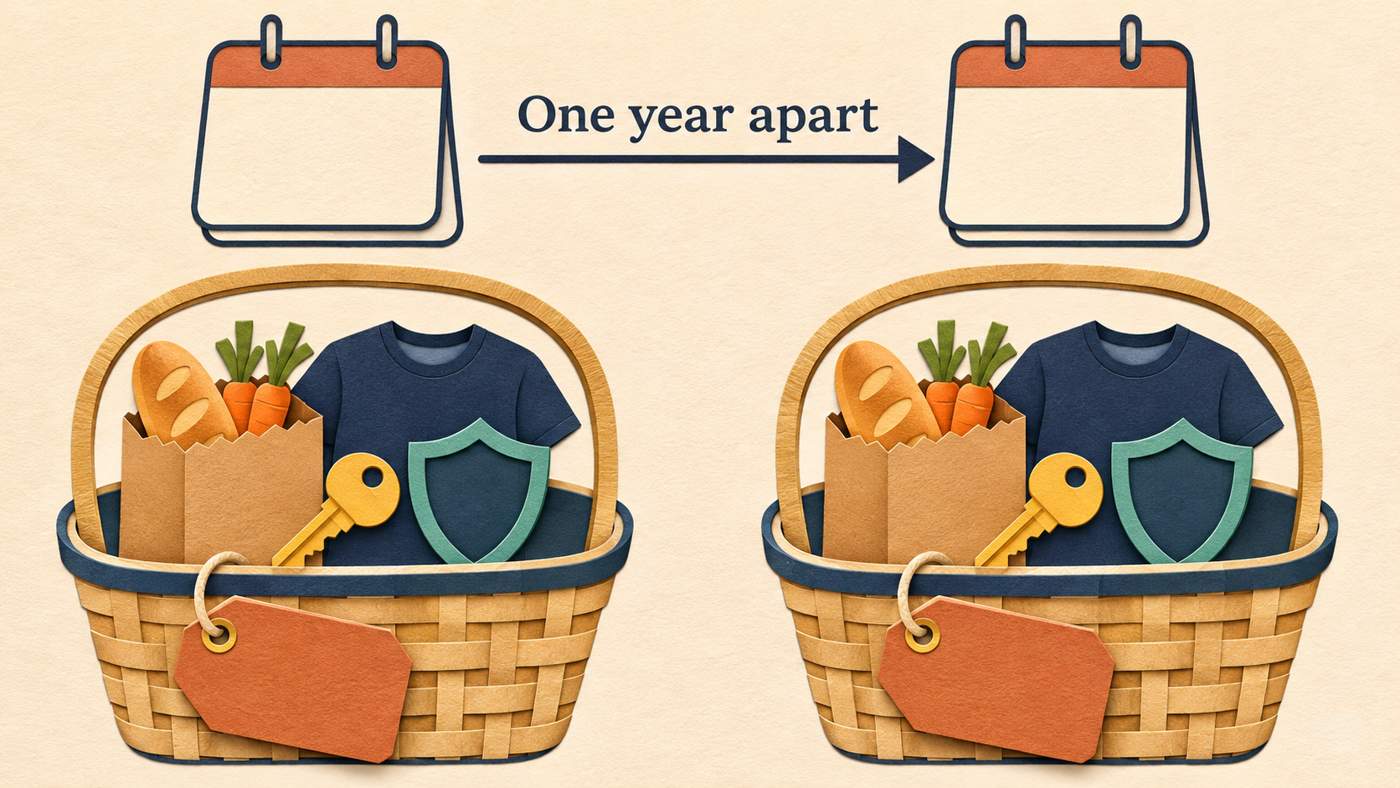
The method works like this:
- Define a "basket" of goods and services households buy. The ECB says this includes everyday items, durable goods such as clothing and appliances, and services such as insurance and rented housing.
- Price that basket in a given month.
- Compare it with the price of the same basket in the same month a year earlier.
The annual inflation rate is that year-over-year change in the basket's cost.
Why do weights make the average differ from your budget?
Not every price counts equally. The ECB explains that products people spend more on, such as electricity, get a greater weight than products they spend less on, such as sugar or postage stamps.
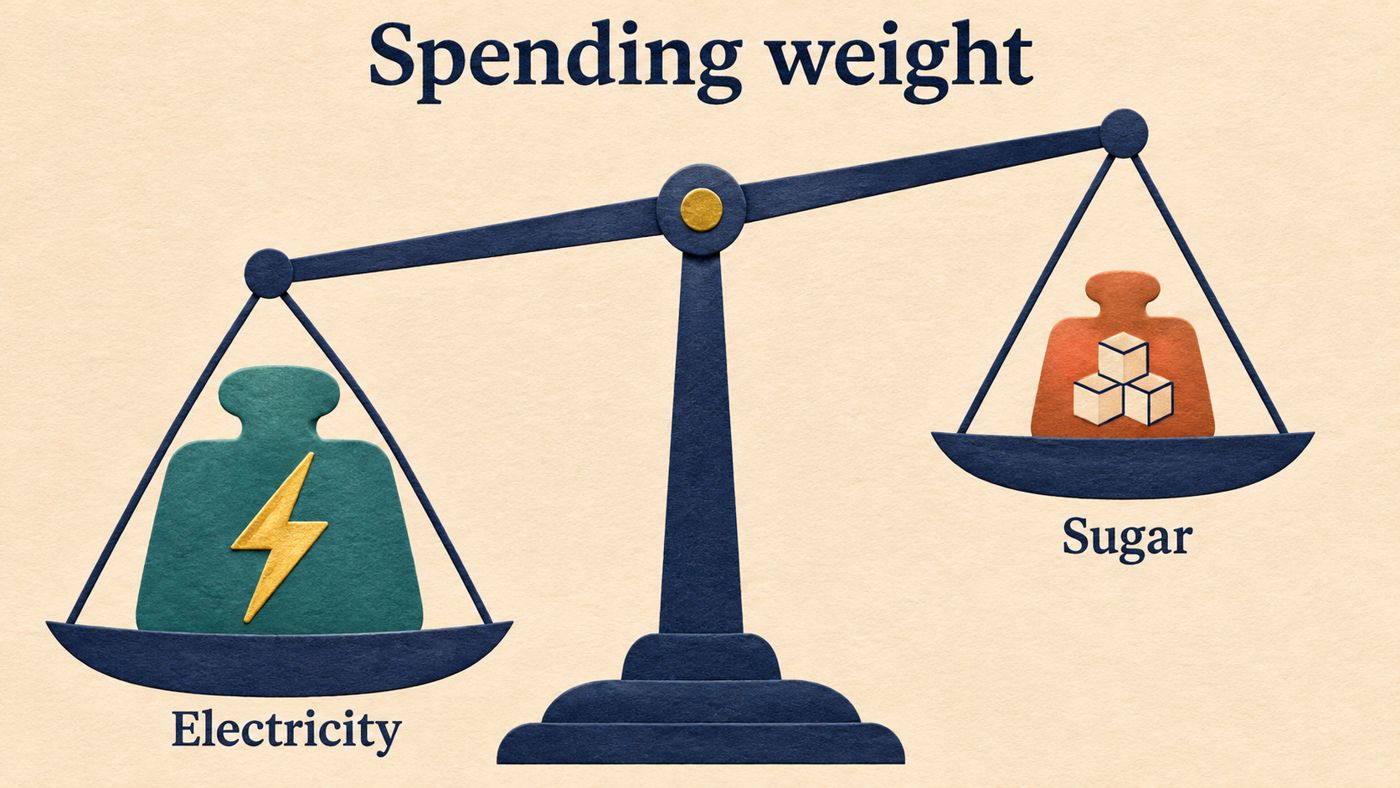
The weights come from the average spending of all households together. The ECB notes that households differ: some own a car and eat meat, while others use only public transport or are vegetarian. The average blends all of them.
The ECB gives a euro-area illustration. Coffee, tea and cocoa together carry a weight of 0.4%. Petrol and other car fuels carry 4.6%. The same percentage price change in petrol therefore moves the overall index about ten times as much as it would for coffee. Those are euro-area weights, not U.S. figures.
How can two households get different inflation rates?
Here is a hypothetical example. It uses made-up numbers to show the mechanics and is not an observed indicator. Assume four spending categories and these one-year price changes: rent +4%, food +2%, fuel +10%, everything else +1%.
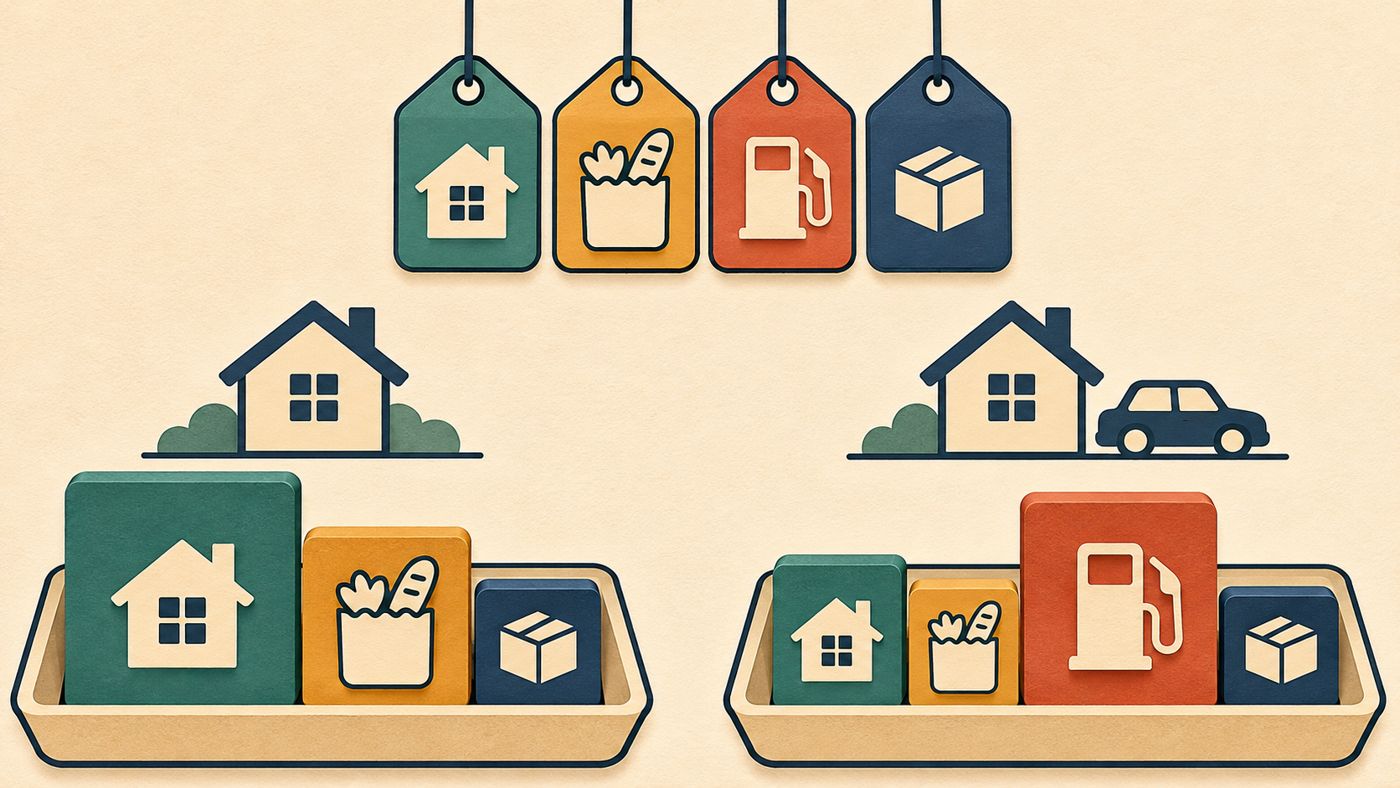
| Spending share | Average household | Household A (no car) | Household B (long commute) |
|---|---|---|---|
| Rent | 40% | 50% | 30% |
| Food | 20% | 25% | 15% |
| Fuel | 10% | 0% | 25% |
| Everything else | 30% | 25% | 30% |
| Weighted price change | 3.3% | 2.75% | 4.3% |
Each result multiplies a category's share by its price change, then adds the products. For the average household: 0.40×4 + 0.20×2 + 0.10×10 + 0.30×1 = 3.3%.
The prices are identical for everyone. Only the spending mix differs, and it produces a gap of more than a full percentage point between Households A and B. A real household's mix also shifts with life events such as a move, a new job or a change in family size.
Why can prices stay high when inflation slows?
The inflation rate describes how fast prices change, not where they sit. The ECB's own worked example shows this. Its sample basket costs €850 in the base year, €875 a year later and €891 two years later. That makes the price index 100.0, then 102.9, then 104.8. Inflation is 2.9% in the first year and 1.8% in the second.
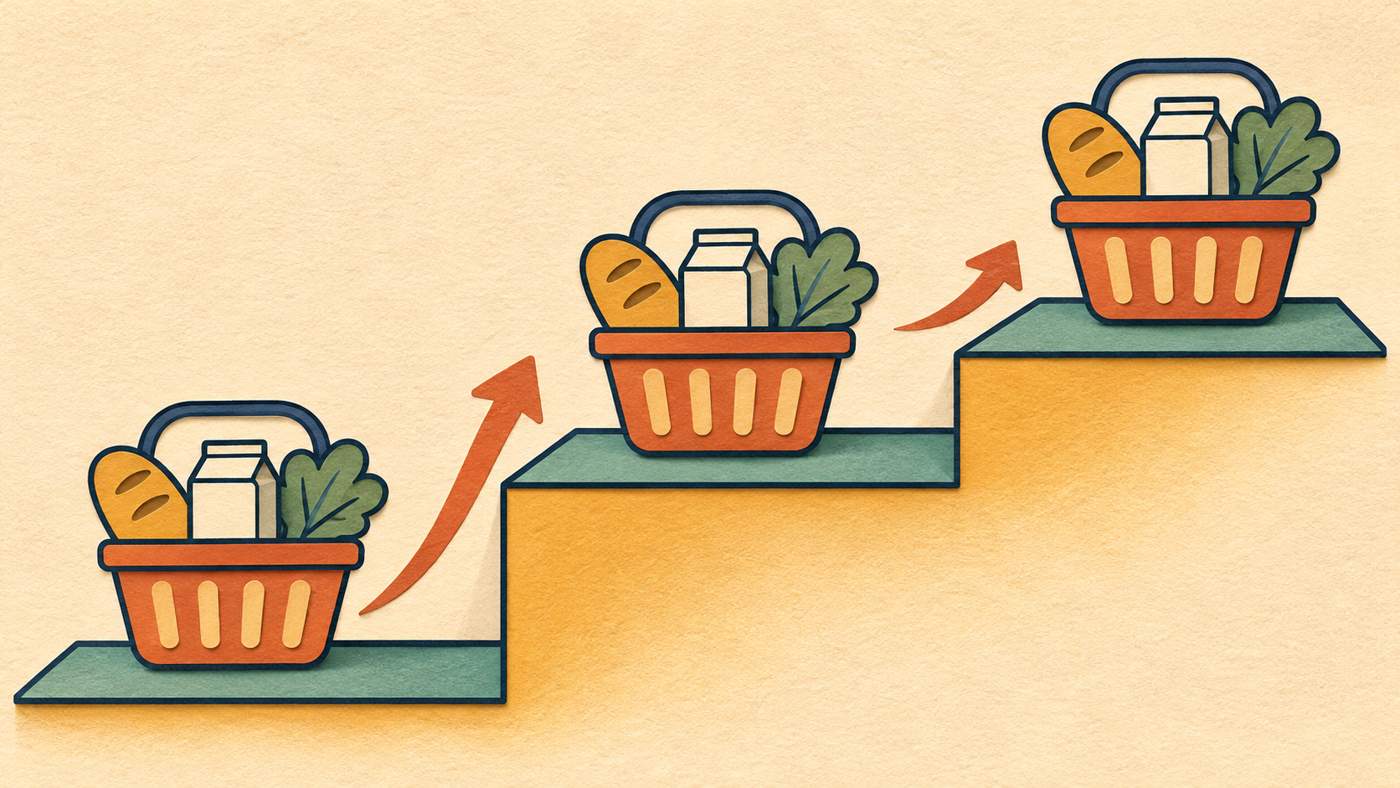
The rate fell, but the basket still cost more than the year before. Slower inflation means prices are climbing more gently, not that they are returning to earlier levels. This is one reason a falling headline rate doesn't necessarily ease pressure on a budget.
How can you read official numbers against your own budget?
You can't calculate a precise personal rate from a headline figure, but you can build a rough picture:
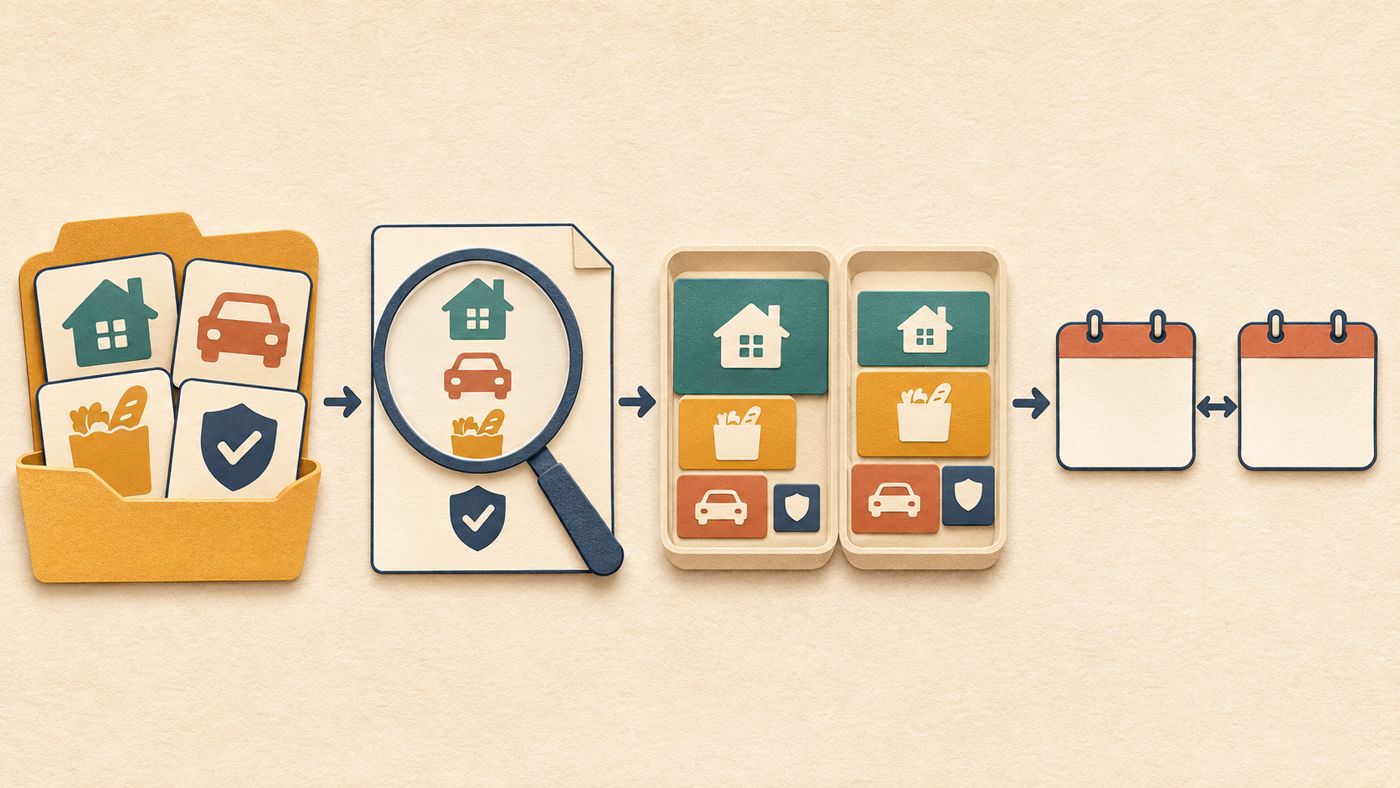
- List your biggest spending categories. Housing, transportation, food and insurance usually matter most to a budget.
- Look for category-level data. Statistical agencies publish price changes by group, not just one total. The ECB says euro-area prices are grouped into up to 295 product categories, and the same idea holds for other indexes.
- Compare your shares with the average. If you spend far more on a category than the official weight suggests, that category's price moves will matter more to you.
- Check the time period. The ECB's headline rate compares a month with the same month a year earlier. A recent monthly jump and a 12-month rate describe different things.
What are the limits of this explanation?
This article explains how a price index works. It doesn't report current inflation rates, forecast prices or recommend any financial decision. The ECB's examples describe the euro-area index, the HICP, which the ECB says covers around 700 goods and services and is updated regularly to reflect changing spending patterns. A U.S. index will have its own basket, weights and update schedule.
For current U.S. figures and the exact method behind them, go to the publishing agency's own methodology pages, such as the Bureau of Labor Statistics for U.S. consumer price data. Check the release date before relying on any number.
 Technology
 Technology