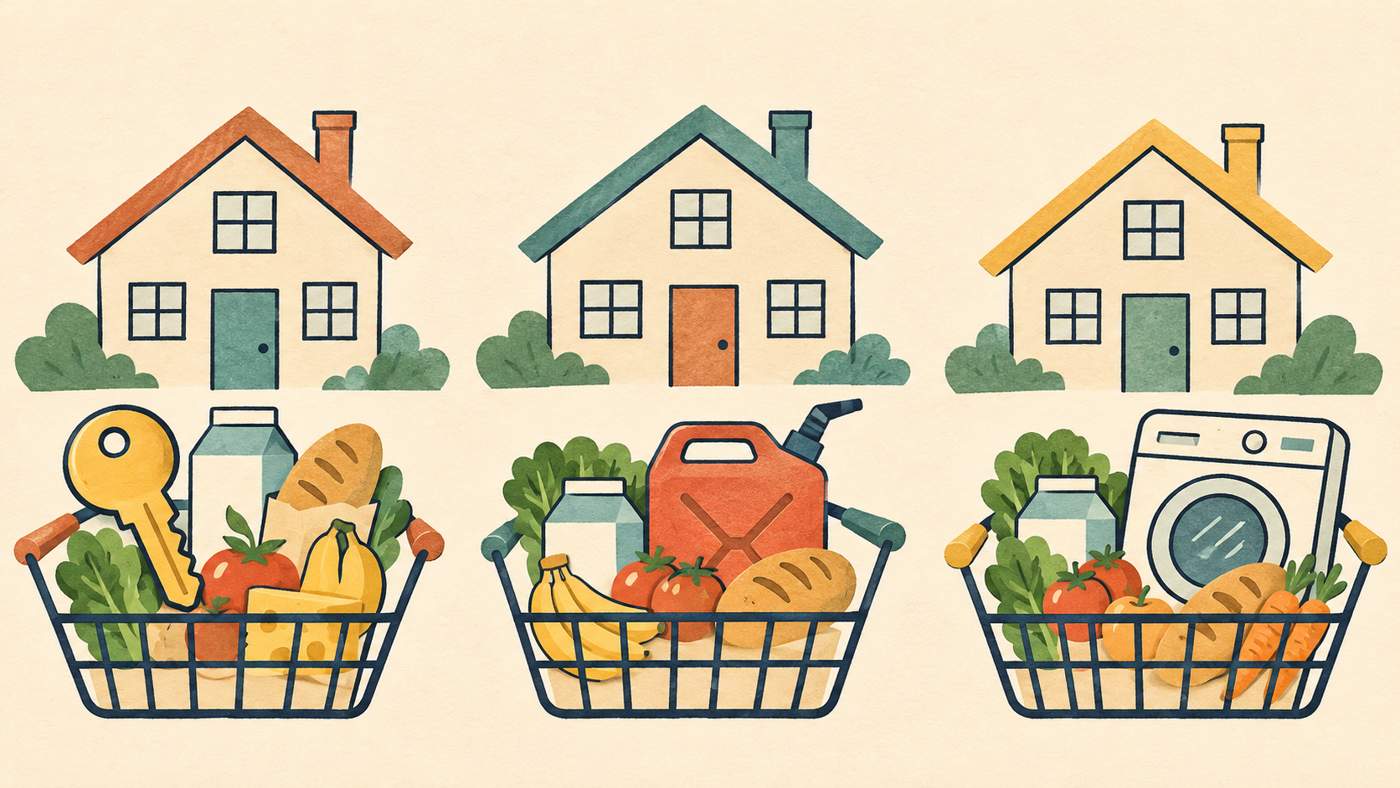
Prices in the news are said to be rising by a certain percentage, yet your own bills seem to be rising faster, or slower. That doesn't necessarily mean the figure is wrong. It's an average, and few households spend like the average.
What does headline inflation actually measure?
The ECB's explainer on inflation defines it as a broad increase in the prices of goods and services, not a rise in individual items. In plain terms, the same money buys less than it did before.
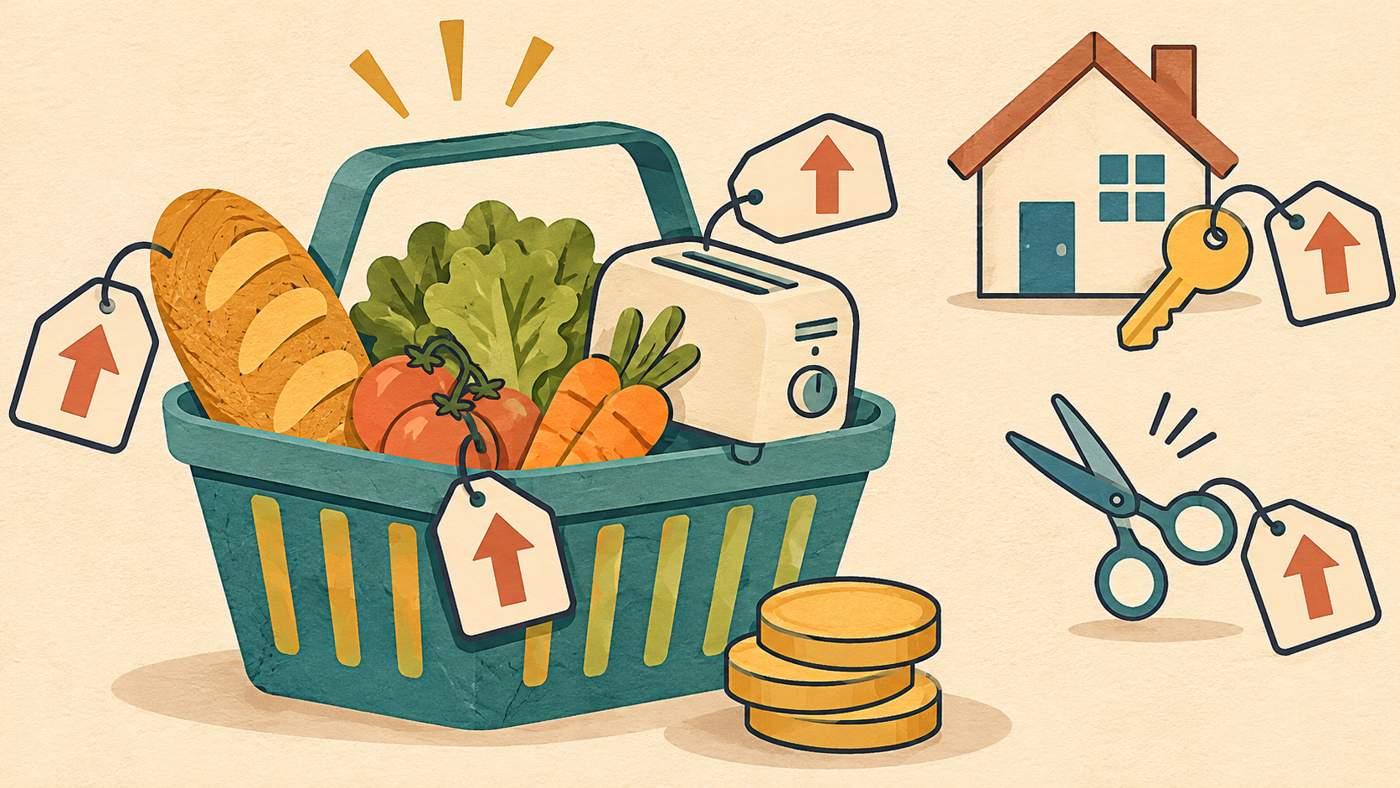
The ECB describes the euro area's measure, so it isn't a description of UK statistics. The underlying idea is a general one, though, and it explains most of the gap between headline and household experience.
How do a basket and weights produce one number?
Statisticians picture a "basket" of everything households consume: everyday items, durable goods such as appliances, and services such as hairdressing, insurance and rented housing. The annual rate compares the cost of that basket in one month with its cost in the same month a year earlier.
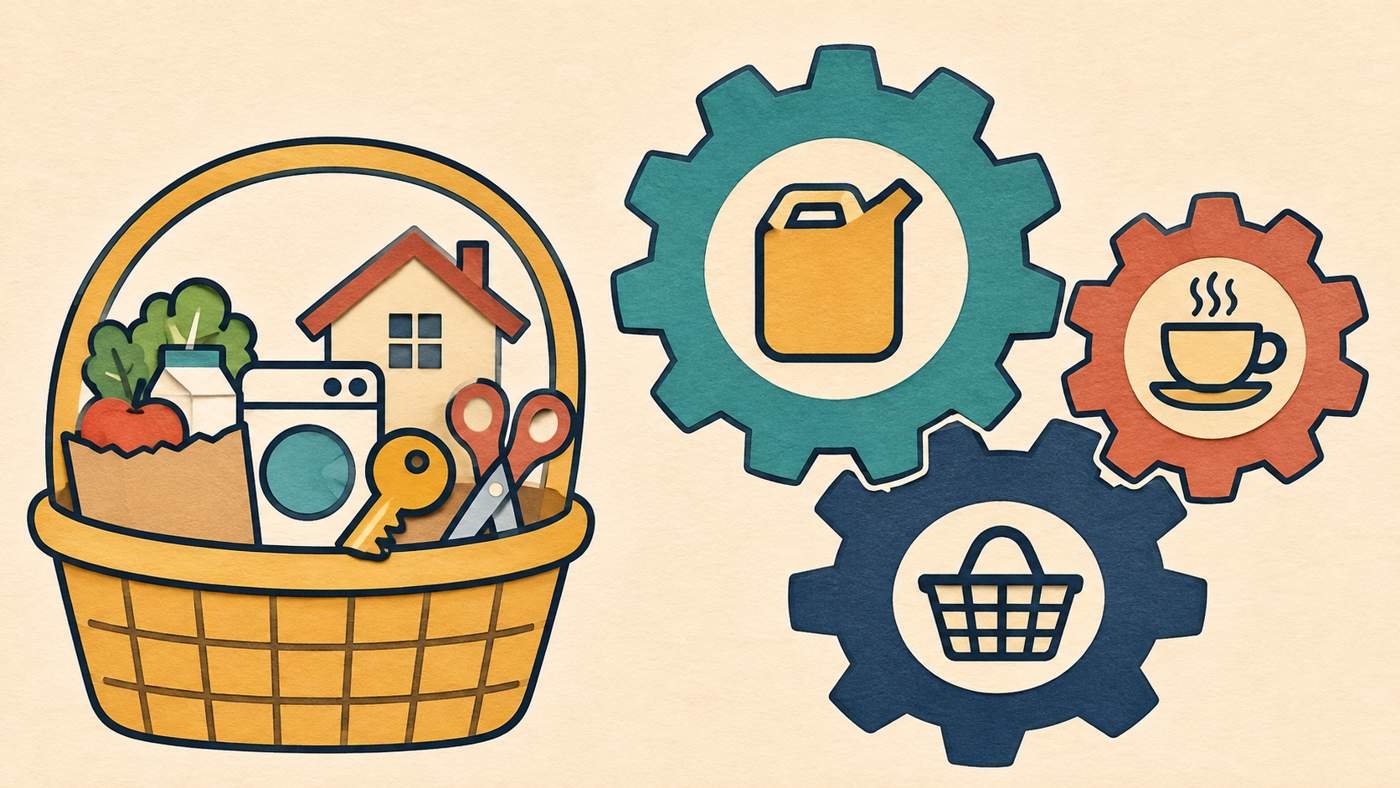
Not every price counts equally. Items that take a bigger share of spending carry a bigger weight. The ECB gives two examples from its euro-area index. Coffee, tea and cocoa together have a weight of 0.4%, while petrol and other car fuels have 4.6%. The same percentage price change for petrol therefore moves the overall index about ten times more than the change for coffee.
Those weights come from the average spending of all households together, and the ECB says they're updated regularly using household spending surveys.
Why might your rate differ? A hypothetical example
The numbers below are invented to show the mechanics. They are not UK data or a forecast.
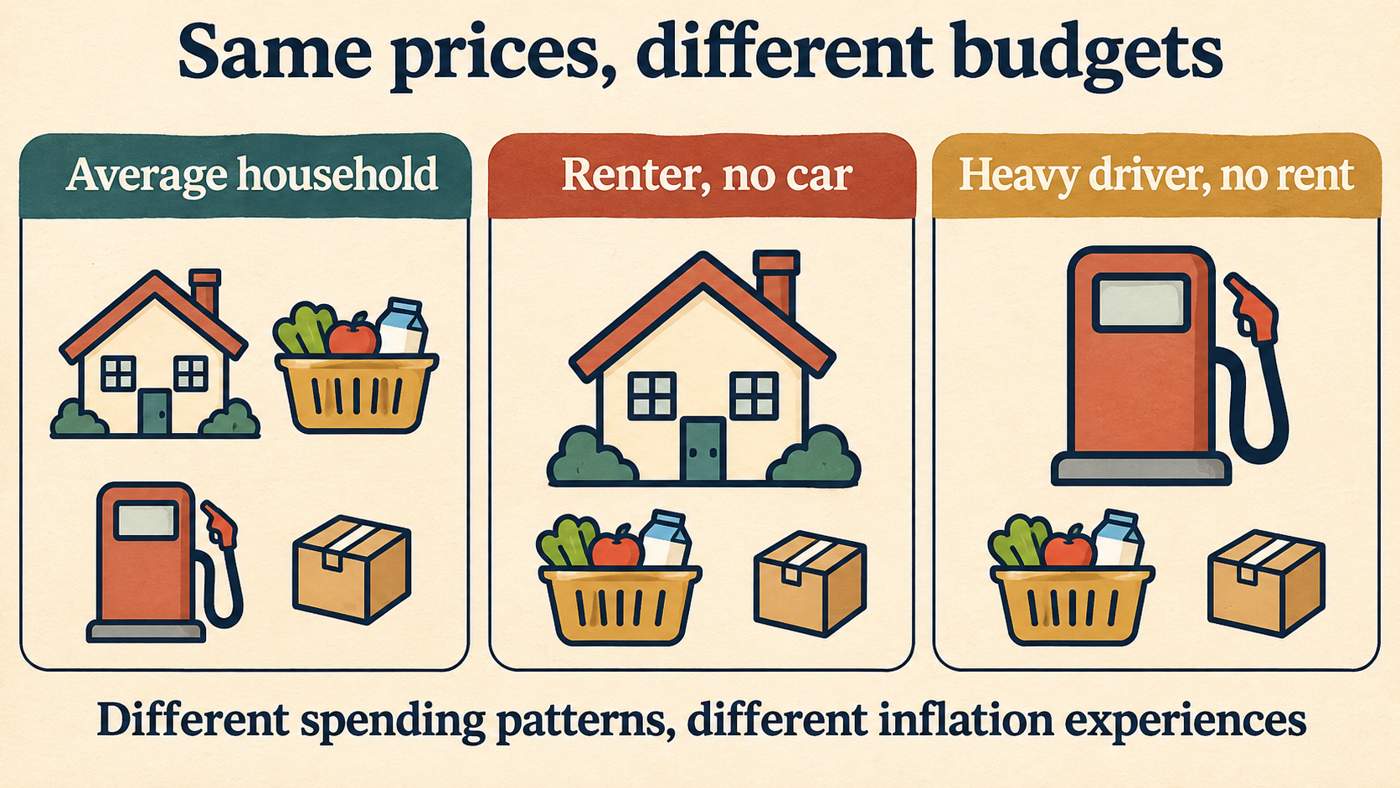
Assume that over one year rent rises 6%, food 2%, fuel 10% and everything else 1%. Then compare three spending patterns, shown as shares of the monthly budget:
| Spending share | Rent | Food | Fuel | Other | Resulting inflation |
|---|---|---|---|---|---|
| "Average" household | 20% | 15% | 5% | 60% | 2.6% |
| Renter, no car | 40% | 20% | 0% | 40% | 3.2% |
| Heavy driver, no rent | 0% | 20% | 20% | 60% | 3.0% |
Each result is the sum of share × price change. For the average household that's 0.20×6 + 0.15×2 + 0.05×10 + 0.60×1 = 2.6%.
Same prices, three different experiences. Nobody's figure is wrong. Their budgets simply lean on different items.
Why do prices stay high when inflation falls?
Inflation is a rate of change, not a price level. The ECB's worked example shows a basket costing 850 in the base year, 875 a year later and 891 a year after that. The index runs 100.0, 102.9 and 104.8, so inflation is 2.9% and then 1.8%.
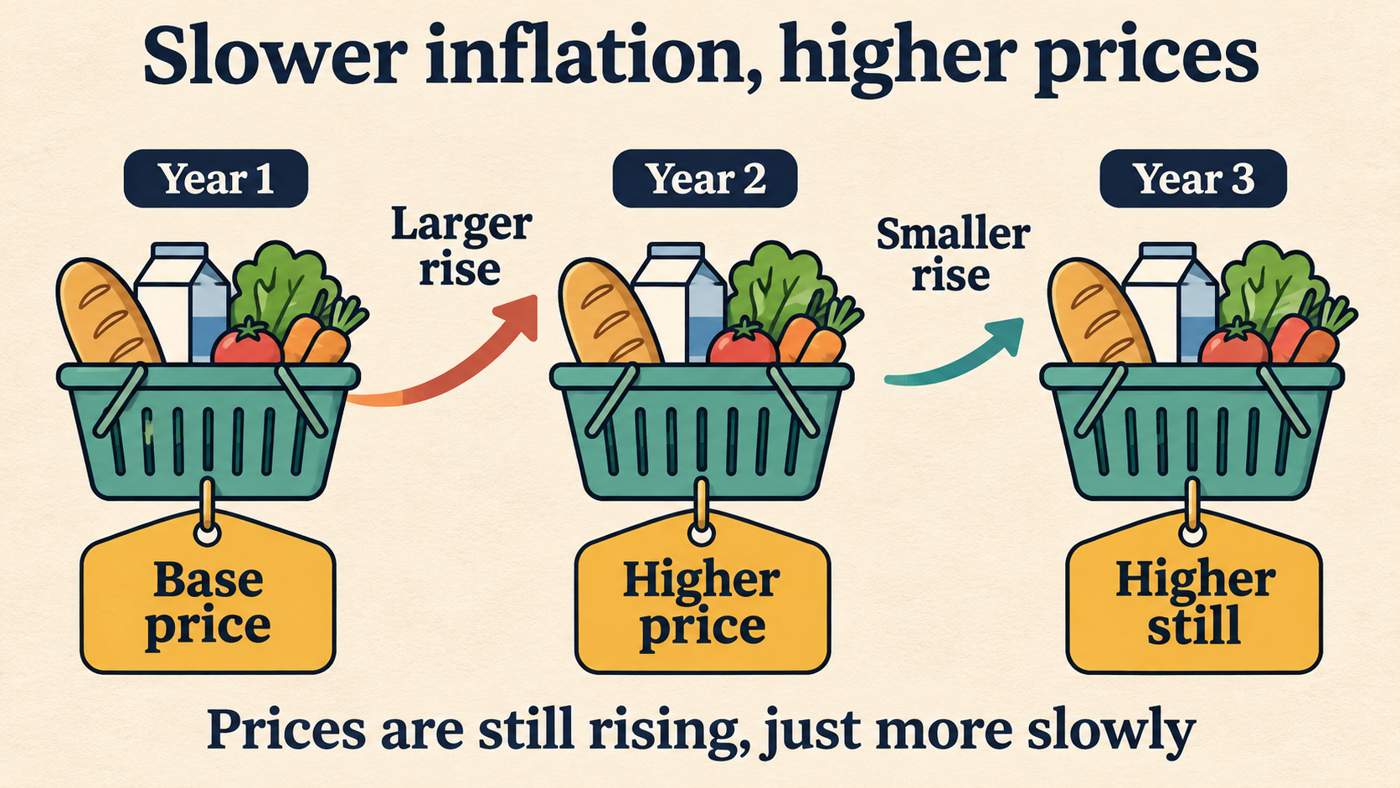
The rate slowed, yet the basket still cost more than it did a year before. A lower inflation rate means prices are rising more slowly. It doesn't mean they're falling back.
How can you check your own budget against the headline?
These steps give a rough personal comparison. They are not a substitute for official statistics.
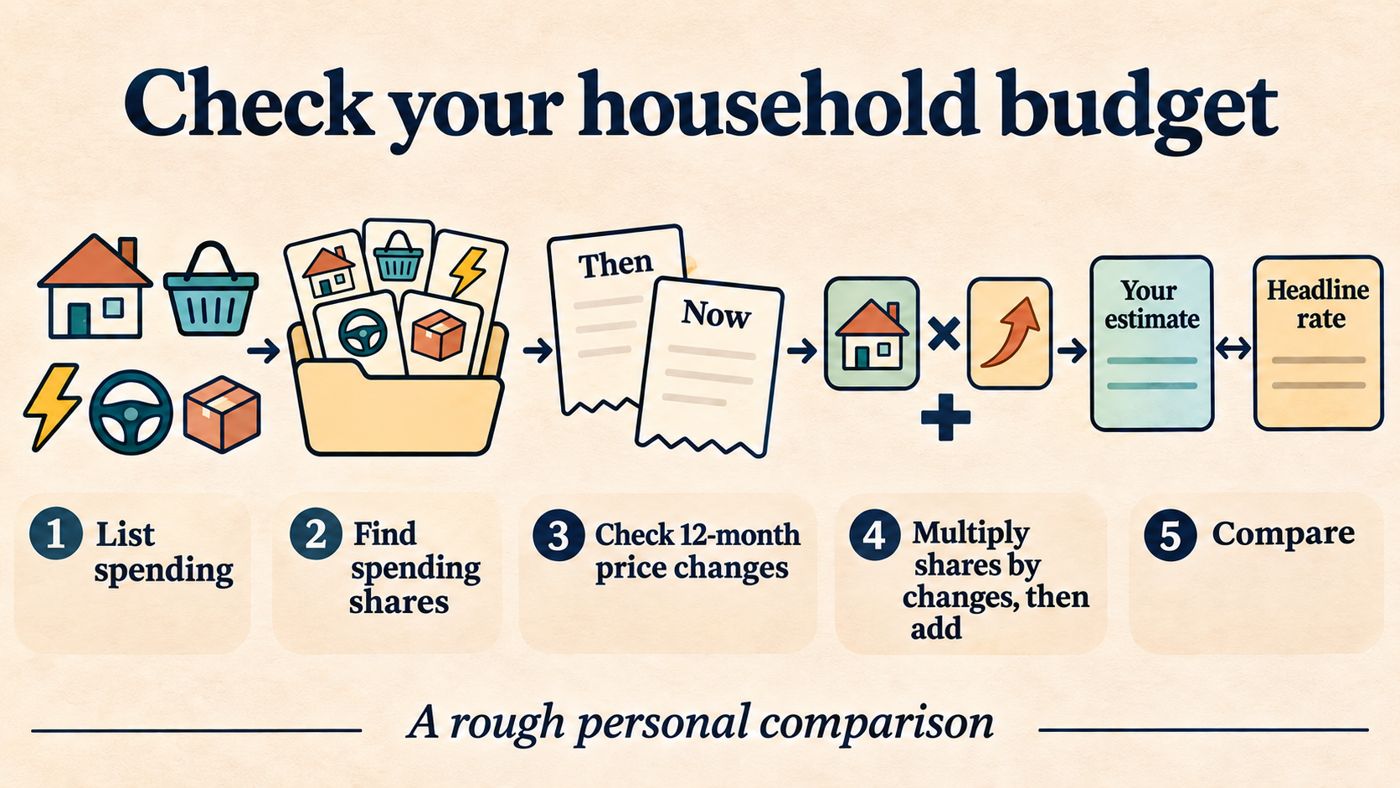
- List your main monthly spending categories, such as housing, food, energy, transport and everything else.
- Work out each as a share of your total spending.
- Note how much each category's price has changed over the same 12 months, using your own bills and receipts.
- Multiply each share by its price change and add the results.
- Compare the total with the published headline rate and see which categories explain the gap.
This is a simplification. Official indices collect millions of prices a month and group them into many product categories, per the ECB's description. A household check will be much cruder.
Where should you look for the official UK figures?
For UK weights, coverage and methods, go to the UK's national statistics producer, the Office for National Statistics, and read its methodology notes. They set out what the UK basket includes and how often the weights change, which this article doesn't attempt to state.
The broader point holds wherever you look. A headline rate tells you how prices moved for a typical spending pattern, and your own rate depends on what you buy. This is an educational explanation, not financial advice.
 Sport
 Technology